

“Start on the help desk and work your way up” was the standard route into technology for twenty years. The federal projections published in August 2026 have computer user support down 3.5 percent and systems administration down 4.1 percent through 2035, while the occupational group both belong to grows 7.3 percent. The ladder did not get taller. Its bottom two rungs are being removed.
This is the most consequential thing in the release for anyone in or entering IT, and it is completely invisible in the headline, which reads as good news for the sector and is.
A 38-point spread inside one group
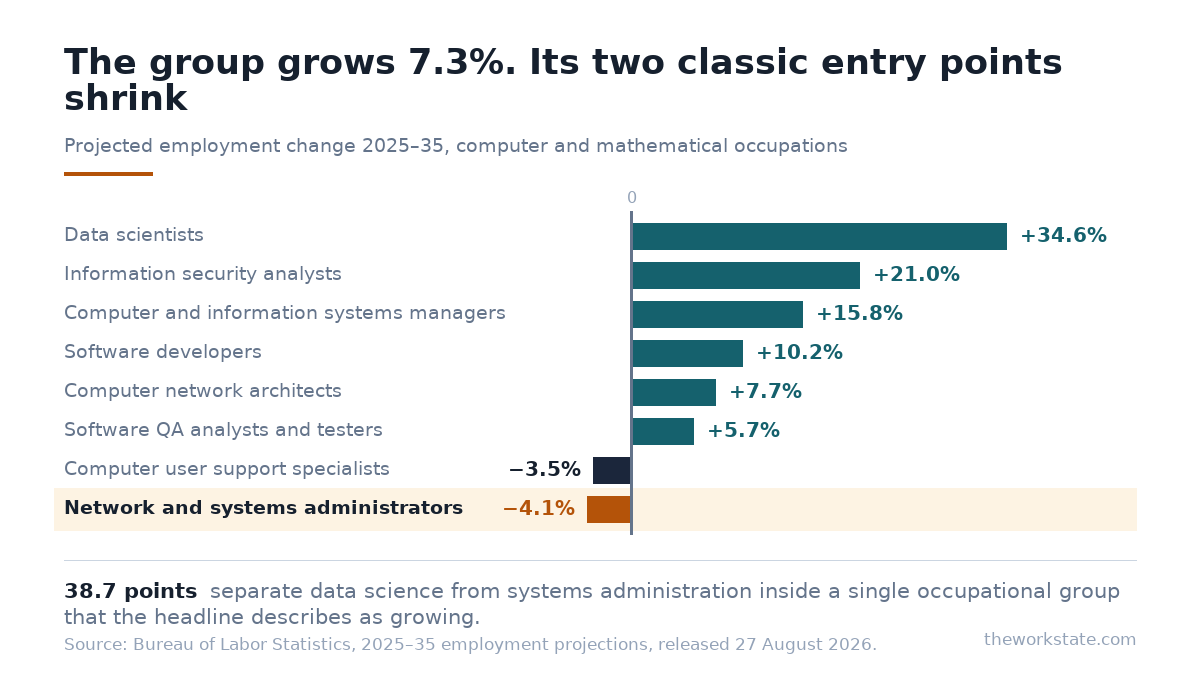
The Bureau of Labor Statistics attributes the group’s growth to “the continued proliferation of digital tools and AI solutions across the economy”, and names data scientists, at +34.6 percent, among the ten fastest-growing detailed occupations in the entire economy.
The same build-out does not lift everything it touches. Infrastructure that is increasingly provisioned as a service needs fewer people administering it in-house, and support tasks that were once a queue of tickets are increasingly a queue of tickets with software in front of them.
The two declining occupations are not the same problem
| Occupation | Median wage | Change to 2035 | Openings a year | 10th–90th percentile |
|---|---|---|---|---|
| Network and computer systems administrators (15-1244) | $99,130 | −4.1% | 13,400 | $62,640 – $155,050 |
| Computer user support specialists (15-1232) | $61,860 | −3.5% | 39,700 | $40,980 – $100,540 |
Systems administration is a well-paid occupation shrinking slowly, with a wide ceiling, a $155,050 ninetieth percentile is a serious career even in decline. User support is a lower-paid occupation shrinking at a similar rate but with three times the annual openings, which is the signature of high turnover rather than high demand.
For someone deciding where to stand, that distinction matters more than the percentages. The senior systems engineer post at Comcast at $70,000 to $95,000 and the help desk manager post at FIS at $80,000 to $100,000 are both good jobs in occupations the projections mark down. They are not equivalent starting points for the decade ahead.
A declining occupation with 39,700 openings a year will keep hiring you. It will not keep promoting you, because the layer above is thinning at the same time.
That mechanic — steady hiring inside a shrinking structure — is the same one running through office and administrative support, where we set out which roles the projections cut and which they leave alone. It is the defining pattern of this projections cycle across several sectors.
Where the build-out is putting the money
Three occupations absorb most of the group’s growth, and the board carries roles in all three.
- Data science (+34.6%, median $120,230). The occupation is projected to add 95,400 posts. The data science manager post at Match Group at $165,000 to $205,000 sits near the occupation’s ninetieth percentile of $199,130, which is what leading the function is worth.
- Information security (+21.0%, median $129,180). The cybersecurity analyst post at NBCUniversal at $110,000 to $145,000 brackets that median closely, a normal market rate in an abnormally fast-growing occupation.
- Technology management (+15.8%, median $175,140). Computer and information systems managers is both large and fast-growing, with 53,500 openings a year. The director of quality assurance post at AT&T at $175,000 to $220,000 sits at and above that median.
Architect titles sit slightly apart. The AI solutions architect post at Deloitte at $145,000 to $185,000 and the cloud solutions architect post at Disney at $145,000 to $195,000 have no exact federal code; the nearest are computer network architects at $134,050 and the catch-all computer occupations category at $116,580. Both postings sit well above either, which tells you these roles are being priced against the market rather than against a series.
Testing is diverging from development
Software developers are projected up 10.2 percent to a median of $135,980. Software quality assurance analysts and testers are projected up 5.7 percent to $104,300 — half the growth and roughly $31,680 less at the median, for work that sits in the same rooms.
This is the context for the SDET title. The SDET post at New York Life at $120,000 to $160,000 is priced between the two medians, which is a fair description of what the role is: test work performed as engineering. Anyone in manual QA looking at that range is looking at the argument for moving toward the development side of the line rather than deeper into the testing side.
If you are in one of the declining roles
- Find out which occupational code your employer classifies you under. “Systems engineer” is used for roles counted as administrators, as architects and as developers, and the three have projections 12 points apart.
- Treat security and data as adjacent, not distant. Both grow fastest, and both routinely recruit from administration and support because the operational knowledge transfers.
- Do not read openings as safety. User support offers 39,700 openings a year in a shrinking occupation, plenty of jobs, fewer destinations.
- If you are in QA, price the engineering version of the role. The gap between the two medians is $31,680 and the work overlaps considerably.
- For architect and AI titles, expect no federal benchmark. Establish which internal band the role was created against before negotiating.
The technology sector is not contracting and this is not a warning about it. It is a warning about a specific piece of career advice that stopped being true: the entry route through support and administration now leads into two of the only shrinking occupations in a growing group. The doors into technology are still open. They have moved.
Employment projections, median annual wages and annual openings are Bureau of Labor Statistics figures from the 2025–35 projections released on 27 August 2026; the quoted explanation of the group’s growth is the bureau’s own. Percentile figures are from the May 2025 Occupational Employment and Wage Statistics. Architect and AI titles have no dedicated federal classification; the comparison codes named are the nearest published series, not an official mapping.

